# Load required libraries
library(shiny)
Warning: package 'shiny' was built under R version 4.5.3library(DBI)Warning: package 'DBI' was built under R version 4.5.3library(RPostgres)Warning: package 'RPostgres' was built under R version 4.5.3library(ggplot2)Warning: package 'ggplot2' was built under R version 4.5.2# Define the User Interface (UI)
ui <- fluidPage(
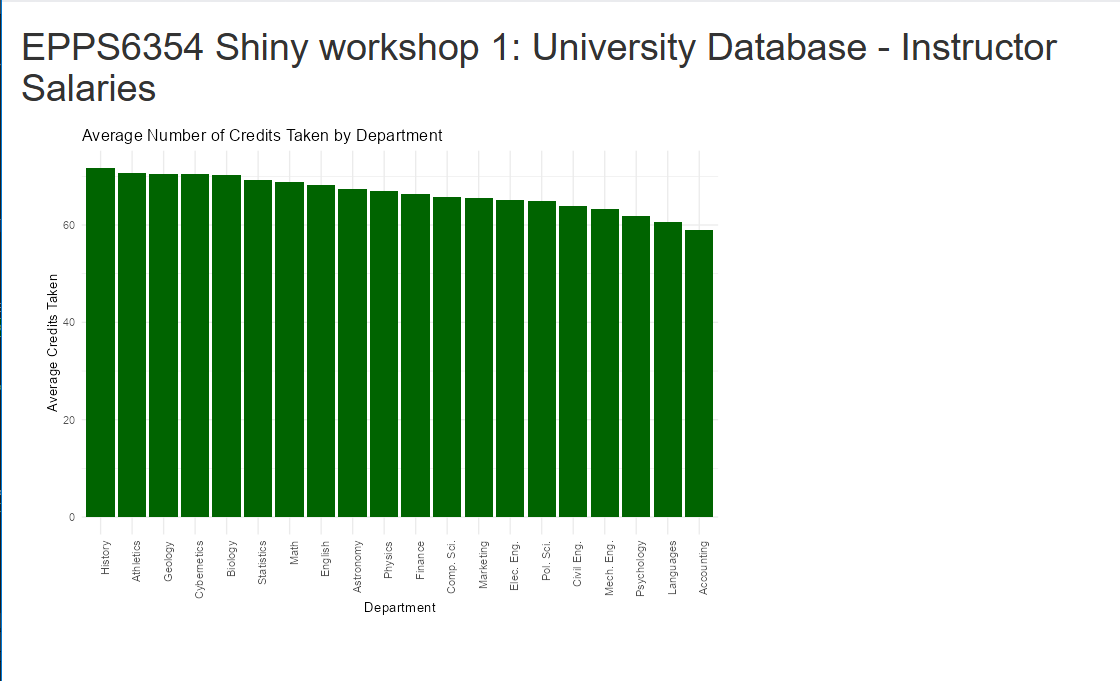
titlePanel("EPPS6354 Shiny workshop 1: University Database - Instructor Salaries"),
mainPanel(
plotOutput("salaryPlot")
)
)
# Define the Server Logic
server <- function(input, output, session) {
# Establish connection to the PostgreSQL database
con <- dbConnect(
RPostgres::Postgres(),
dbname = "university", # Adjust if your database name differs
host = "localhost",
port = 5432, # Default PostgreSQL port
user = "postgres", # Your PostgreSQL username
password = "pgAdmin" # Your PostgreSQL password
)
# Ensure the database connection is closed when the session ends
session$onSessionEnded(function() {
dbDisconnect(con)
})
# Reactive expression to fetch average salary by department
instructor_data <- reactive({
query <- "SELECT dept_name, AVG(tot_cred) AS avg_cred
FROM student
GROUP BY dept_name;"
dbGetQuery(con, query)
})
# Render the plot for average instructor salary by department
output$salaryPlot <- renderPlot({
data <- instructor_data()
ggplot(data, aes(x = reorder(dept_name, -avg_cred), y = avg_cred)) +
geom_bar(stat = "identity", fill = "darkgreen") +
theme_minimal() +
labs(
title = "Average Number of Credits Taken by Department",
x = "Department",
y = "Average Credits Taken"
) +
theme(
axis.text.x = element_text(angle = 90, hjust = 1),
text = element_text(family = "Palatino")
)
})
}
# Run the Shiny application
shinyApp(ui = ui, server = server)PhantomJS not found. You can install it with webshot::install_phantomjs(). If it is installed, please make sure the phantomjs executable can be found via the PATH variable.Shiny applications not supported in static R Markdown documents